

 The boardroom bet that keeps burning budgets
Picture the usual scene. A room of senior people reviews three polished ad concepts, picks the one they like best, and commits a seven-figure budget to a single launch. Then everyone waits and hopes. That is not a strategy. It is a bet placed on personal taste, and on paid social it is an expensive one. Your audience does not know what the commercial cost, and it does not care how attached the creative director is to the script. People decide in the first second and a half of a scroll, with a thumb, and they do not explain themselves.
We built GrowthCharter around the opposite idea. Real audience behaviour decides what runs, what gets cut and where the next Rand goes. Our promise is short enough to put on a wall: we don’t guess, here are the receipts. This article shows you what those receipts look like, what they mean for a business, and how to judge any agency’s proof, including ours.
Every agency has a case study slide. A receipt is different, It is a number that comes from the platform, ties to a business outcome, and could survive a CFO asking where it came from.
We hold ourselves to three tests before a result goes in a report or on this blog:
The rest of this article runs our headline results through those three tests.
 4.8 billion views: attention earned at scale
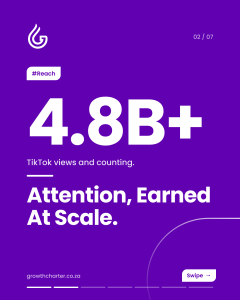
Anyone with an unlimited budget can buy views. Earning more than 4.8 billion of them while holding performance benchmarks is a different job, and it comes down to creative volume and iteration rather than media spend alone. Reach on a modern video platform is not built by launching one hero commercial and leaving it for six months. Fatigue sets in quickly, cost per thousand impressions creeps up, and results sag within weeks. So our studio works the other way round. We produce many angles at once and test creators, native hooks, on-screen text and audio side by side. Then we let the platform show us which versions it wants to distribute.
The best-performing paid creative usually looks like it belongs in the feed. When a video blends into the For You Page, people watch longer, the algorithm reads that as a quality signal, and distribution widens. Longer watch time lowers the cost of each impression, and lower impression cost is what makes billion-scale reach affordable. This is also why a R500,000 studio production can lose to a creator filming on a phone. The platform does not reward production value. It rewards attention that is kept.
 2.7% CTR: stopping the scroll
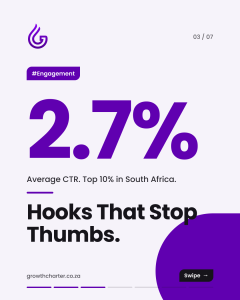
Reach without action is a vanity metric, If someone watches three seconds and scrolls on, that media spend might as well be invisible. Across our active client campaigns we average a 2.7% click-through rate. Paid social CTRs in South Africa typically sit between 0.8% and 1.2%, so we are running at more than double the usual range, which places our creative in the top 10% of advertisers nationally. In practical terms, 2.7% means that for every 1,000 people who see an ad, roughly 27 click through. At a typical benchmark of 1%, you would get ten.
A hook is not a clever opening line. It is a designed sequence that has to earn the next three seconds. We build ours from three parts:
None of these is a secret. What makes them work is doing all three, on every asset, and testing five versions of the opening before anyone commits to a winner.
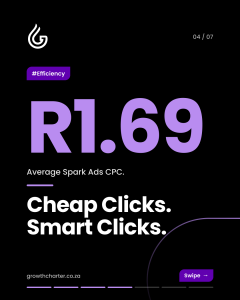 R1.69 CPC: cheap clicks that actually count
Our campaigns average a R1.69 cost per click. A big part of that comes from Spark Ads, which boost an existing organic video from a brand page or a creator profile. The video keeps its likes, comments and shares, so the ad arrives with social proof attached instead of looking like a cold interruption. A low CPC is only a receipt if the clicks go somewhere valuable. A R0.50 click that never converts is more expensive than a R3 click that does. That is why we treat CPC as an early-warning signal and judge success on cost per qualified lead further down the funnel.
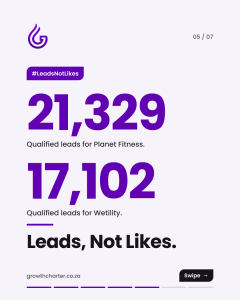 Leads, not likes: Planet Fitness and Wetility
Here is where the receipts become business results.
Different categories, different audiences, same engine. The common thread is that in both cases the creative did the work of qualifying people. Clear hooks and honest offers meant the leads who came through were the ones the client actually wanted to speak to.
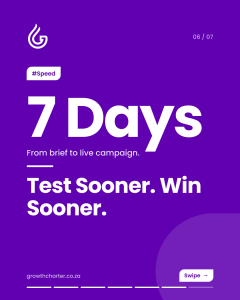 7 days from brief to live
Speed is a performance lever in its own right. Every week spent debating a single concept is a week without data. From brief sign-off to live campaign, our turnaround is seven days, which means you are learning from real audiences while a traditional production schedule is still in script approval.
Whether you work with us or not, hold every agency to the same standard. Ask these five questions before you sign anything:
If the answers are vague, you are being sold a story. If they are specific, you are looking at a receipt.
Media costs, load-shedding-era budgets and a consumer who is careful about every Rand mean South African marketers have less room for waste than their counterparts in larger markets. A campaign that underperforms for a month is not an abstract learning. It is a quarter’s targets under pressure. That is why proof matters here. When budgets are tight, the question is rarely “is this creative award-worthy?” It is “what did each qualified lead cost, and can we get more of them next month?” A performance partner should be able to answer that question on the spot, with numbers.
Take the figures above and translate them into planning terms. A high CTR means the same media budget buys more visits. A low CPC stretches it further. Strong creative means those visits arrive already interested, so the cost per lead falls. Each metric compounds the next. Over a quarter, this is the difference between a budget that has to be topped up to hit targets and one that does more than expected. That is the real argument for Test, Optimise, Scale. It does not make media free, but it makes sure every Rand is working as hard as the data can show.
Without clear measurement, three expensive things happen. Teams keep funding underperformers because nobody can prove they are underperforming. Strong creative is not recognised, so it isn’t scaled. And post-campaign reviews turn into opinion contests where the loudest voice wins. Receipts end all three.
Pull your last three campaigns and rank the creative by cost per qualified lead, not by how much the team liked it. Then look at what the top three have in common: the opening line, the voice, the length, the offer. That list is the start of your own set of receipts, and it will tell you more about your audience than any brainstorm. Repeat the exercise monthly. Over a few cycles, you will build a picture of what your market responds to that no agency pitch can replicate.
 Ready to see your own numbers?
GrowthCharter runs every campaign on a Test, Optimise, Scale basis, with reporting you can check. Book a strategy call and we will show you what your first 7 days could look like.